Refer to the following graph.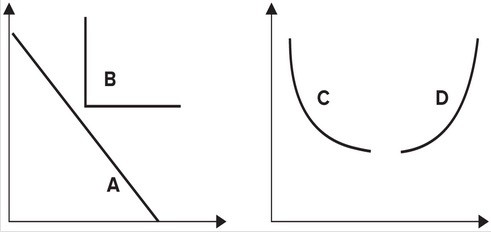 An indifference curve with a constant marginal rate of substitution is shown by:
A. A.
B. B.
C. C.
D. D.
Answer: A
You might also like to view...
If the marginal propensity to consume (MPC) is 0.75, and if the goal is to increase real GDP by $400 million, then by how much would government spending have to change to generate this increase in real GDP?
a. $140 million. b. $100 million. c. $200 million. d. $400 million.
Revenue for state and local governments is mainly sourced from: a. personal income taxes
b. sales and property taxes. c. corporate income taxes. d. license fees.
Prior to the Great Depression, most economists believed that a recessionary downturn would be reversed by
a. higher wages that would stimulate aggregate demand and reduce unemployment. b. lower wages that would increase the quantity of labor demanded and reduce unemployment. c. an expansionary monetary policy on the part of the Federal Reserve System. d. an increase in government spending that would stimulate aggregate demand and employment.
The largest component of national income is:
a) compensation of employees. b) rents. c) interest. d) corporate profits.