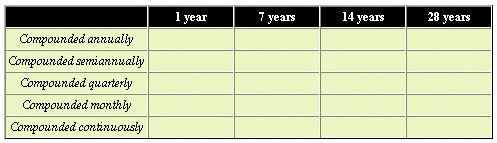
Complete the following chart, which illustrates what happens to $8,000 invested at 12% for different lengths of time and different numbers of compounding periods. Round all of your answers to the nearest dollar.
?
?
A. 
B. 
C. 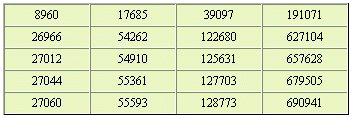
D. 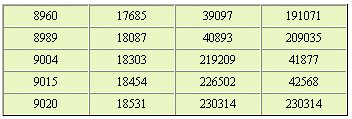
E. 
Answer: A
Mathematics
You might also like to view...
Graph.f(x) = (x - 4)2 + 1
A. 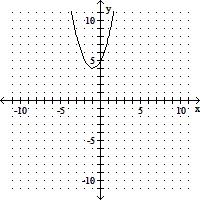
B. 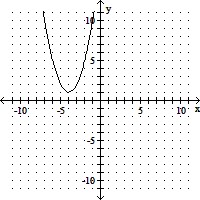
C. 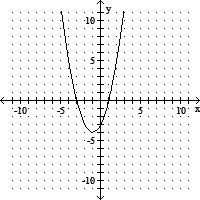
D. 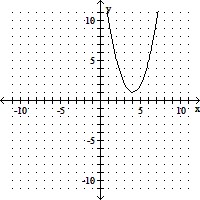
Mathematics
Find functions g and h such that f(x) = g(h(x)).f(x) = ln (4x5 - 5)
A. g(x) = x, h(x) = ln (4x5 - 5) B. g(x) = ln x, h(x) = 4x5 - 5 C. g(x) = ln x5, h(x) = 4x - 5 D. g(x) = 4x5 - 5, h(x) = ln x
Mathematics
Write the fraction as a decimal.
A. 0.2 B. 0.25 C. 0.75 D. 0.3
Mathematics
The graph of a logarithmic function is shown. Select the function which matches the graph.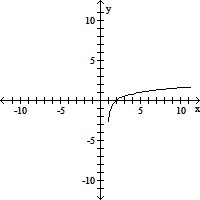
A. y = log4x B. y = log4(x + 1) C. y = log4x - 1 D. y = log4(x - 1)
Mathematics