The table shows, for some particular year, a listing of several income levels and, for each level, the proportion of the population in the level and the probability that a person in that level bought a new car during the year. Given that one of the people who bought a new car during that year is randomly selected, find the probability that that person was in the indicated income category. Round your answer to the nearest hundredth. 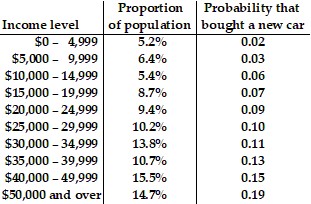 $25,000 - $29,999
A. 0.09
B. 0.14
C. 0.07
D. 0.13
Answer: A
Mathematics
You might also like to view...
Find the standard equation of a parabola with the given focus or directrix. Assume that the vertex is at the origin.Directrix x = -9
A. y2 = -9x B. x = 36y2 C. y2 = 36x D. x2 = 36y
Mathematics
Answer the following statement(s) true (T) or false (F)
Available research shows that teachers can consistently predict students' achievement level on a topic solely by examining how much instructional time is spent on it.
Mathematics
Determine the prime factorization of the number. Write your answer in exponent form.165
A. 3 ? 5 ? 11 B. 15 ? 11 C. 32 ? 11 D. 52 ? 3
Mathematics
Provide an appropriate response.Factor: x2 + 13x + 40
A. (x + 5)(x + 8) B. (x + 4)(x + 10) C. (x + 2)(x + 20) D. (x + 3)(x + 10)
Mathematics