Refer to the following graphs to determine an appropriate response.Graph AGraph B 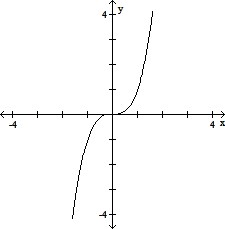
 ? Graph CGraph D
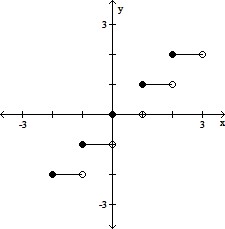
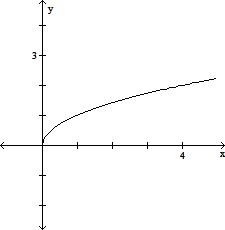 Which one is discontinuous over its domain? What is its range?
A. graph B; (-?, ?)
B. graph C; (-?, ?)
C. graph B; [0, ?)
D. graph C; {-2, -1, 0, 1, 2}
Answer: D
You might also like to view...
At a maximum value of  ,
,  is negative.
Answer the following statement true (T) or false (F)
Find dy.y = 2x2 + 3x - 9
A. 4x - 9 dx B. (4x + 3) dx C. 4x dx D. 4x + 6 dx
Provide an appropriate response.Suppose the supply and demand equations for a manufacturer's product are  and
and  respectively, where q represents number of units and p represents price per unit in dollars. Determine (a) the equilibrium quantity; (b) the equilibrium price. If a tax of $1.00 per unit is imposed on the manufacturer, (c) determine the new equilibrium quantity; (d) the new equilibrium price.
What will be an ideal response?
Solve the problem.What is the difference between a daytime temperature of 10° F and a nighttime temperature of -6° F?
A. 16°F B. 4°F C. -4°F D. -16°F