Refer to Figure a. Assuming the solid line in the graph is a constant expected consumption line where ? (the probability of state S) = 0.50, which constant expected consumption line reflects an increase in ??
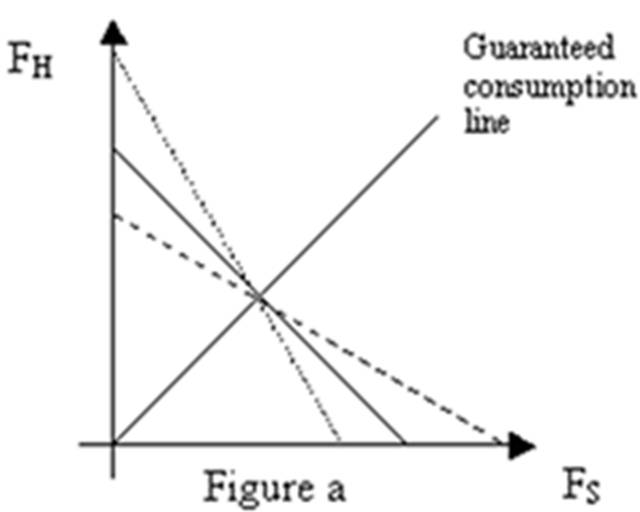
A. The dotted line
B. The dashed line
C. An increase in ? does not result in a change in the expected consumption line.
D. A change in ? results in a parallel shift in the expected consumption line, so neither the dotted nor the dashed line reflects this change.
A. The dotted line
You might also like to view...
A lower price level combined with a decrease in real GDP occurs when the
A) short-run aggregate supply curve shifts rightward. B) short-run aggregate supply curve shifts leftward. C) aggregate demand curve shifts rightward. D) aggregate demand curve shifts leftward.
A flat wage profile refers to
A) wage compression. B) backloaded compensation. C) an efficiency wage. D) deferred compensation.
It is possible for an economy to produce more than its potential level of output, at least for a short period of time
a. True b. False
Which of the following is the best example of an investment in human capital?
A. on-the-job training received by an apprentice electrician B. an increase in the number of hours worked per week by a worker in an unskilled laboring job C. the purchase of company stock by a worker D. payments into a retirement pension plan by a skilled laborer