Solve the problem. The following data shows the number of housing starts in various years in one beachside community. 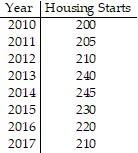 Let f(t) be the number of housing starts at t years since 2009. Use a graphing calculator to plot a scatterplot to describe the data. Using the same viewing window, draw the graph of the quadratic model
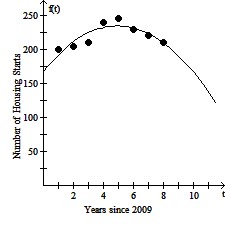
 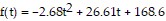 . Use the model to predict the number of housing starts in the year 2021.
What will be an ideal response?
Predicted number of housing starts in 2021 is roughly 102.
Mathematics
You might also like to view...
Solve the problem.Suppose you purchase a 10-year U.S. savings bond with an APR of  %. The face value of the bond is $8000. Find the purchase price of the bond.
A. $6400 B. $6527.28 C. $6530.61 D. $6403.20 E. $6464.65
Mathematics
Write the percent as a decimal.60%
A. 0.6 B. 6 C. 0.06 D. 0.49
Mathematics
Solve the equation for solutions in the interval [0, 2?).tan 2x - tan x = 0
A. {0}
B. 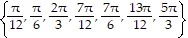
C. {0, ?}
D. 
Mathematics
Multiply and simplify.-6z ? 
A. 0 B. 36z C. 1 D. -1
Mathematics