Refer to the graph shown. As a result of the shift from D1 to D2, the value of the dollar will: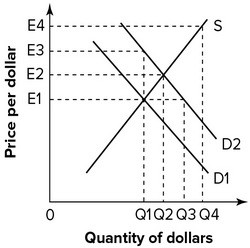
A. increase in response to excess demand equal to Q3 - Q1.
B. increase in response to excess demand equal to Q4 - Q2.
C. decrease in response to excess supply equal to Q4 - Q2.
D. decrease in response to excess supply equal to Q3 - Q1.
Answer: A
You might also like to view...
A high HHI indicates that a market may be dominated by one large firm
Indicate whether the statement is true or false
What factors have served to open up world markets to increased international trade?
a. improvements in communications and transportation b. increased tariffs and legislation protecting industries c. an emphasis on regional markets and local sourcing d. climate change and rising environmental awareness
This graph shows the marginal cost and marginal benefit associated with roadside litter clean up. Assume that the marginal benefit curve and marginal cost curve each have their usual slope.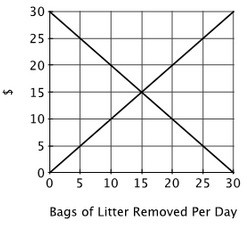 From the graph, one can infer that:
A. the marginal cost of picking up the 10th bag of litter exceed the marginal benefit. B. the marginal benefit of picking up the 20th bag of litter exceed the marginal cost. C. the total benefit of having 30 bags removed is zero. D. the marginal benefit of picking up the 10th bag of litter exceed the marginal cost.
Refer to the information provided in Figure 29.1 below to answer the question(s) that follow.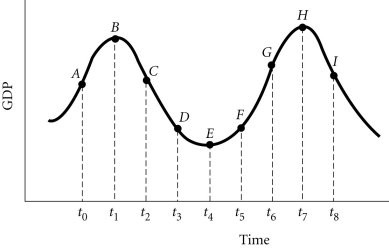 Figure 29.1Refer to Figure 29.1. If policy makers decide to on a policy at Point t5 but it does not affect the economy until period t7, then the policy choice is likely to be
A. ineffective. B. inappropriate. C. optimal. D. none of the above.