Solve the problem.The following table shows the median number of hours of leisure time that Americans had each week in various years. (i) Use a graphing calculator to fit a quadratic sequence regression function an = an2 + bn + c to the data, where n is the number of years after 1973. (ii) Estimate the median number of leisure hours per week in 2000 and 2010. Round to the nearest hour.
A. (i) an = -0.021n2 + 1.44n + 28.07;
(ii) 52 hours; 53 hours
B. (i) an = 0.04n2 - 1.21n + 26.03;
(ii) 23 hours; 36 hours
C. (i) an = -0.04x2 + 1.21x + 26.03;
(ii) 30 hours; 16 hours
D. (i) an = 0.021x2 - 1.44x + 28.07;
(ii) 4 hours; 4 hours
Answer: B
You might also like to view...
Evaluate the integral.
A. -  (7x2 + 3)-4 + C
B. -  (7x2 + 3)-4 + C
C. -  (7x2 + 3)-6 + C
D. -  (7x2 + 3)-6 + C
Find the extreme values of the function and where they occur.y = 
A. Absolute maximum is -  at x = 0; absolute minimum is 1 at x = -2.
B. Absolute maximum is 3 at x = 0; absolute minimum is  at x = -2.
C. None
D. Absolute maximum is  at x = 0; absolute minimum is - 1 at x = -2.
Find the LCM of the given polynomials.12x - 7, 12x + 7
A. (12x - 7) or (12x + 7) B. (12x - 7)(12x + 7) C. (12x - 7) D. (12x + 7)
Use the circle graph to solve the problem. Give your answer as a fraction, decimal, and as a percent.The circle graph below shows the majors for 360 college students at Blackwood Community College. What portion of the students are majoring in science?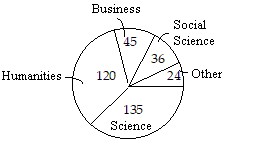
A.  ; 0.33; 3.3%
B.  ; 0.375; 3.75%
C.  ; 0.375; 37.5%
D.  ; 0.33; 33%