According the graph shown, the profit-maximizing decision of the monopolist would be:
This graph shows the cost and revenue curves faced by a monopoly.
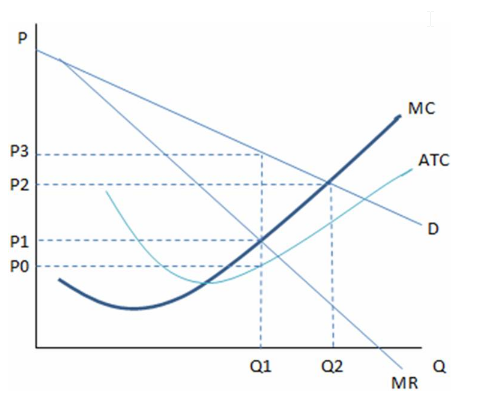
A. Q1, P1.
B. Q1, P3.
C. Q2, P2.
D. Q1, P2.
B. Q1, P3.
You might also like to view...
Factors that can cause the supply curve for bonds to shift to the right include
A) an expansion in overall economic activity. B) a decrease in expected inflation. C) a decrease in government deficits. D) a business cycle recession.
Which of the following could explain why a firm that is not a monopoly becomes one?
a. patent b. increasing ease of access to resources c. mutual interdependence d. the number of substitute goods falls from many to few e. a perfectly horizontal firm demand curve
Which is a reason why there is no advertising by individual firms under pure competition?
A. Firms produce a homogeneous product. B. Firms do not make long-run profits. C. The quantity of the product demanded is very large. D. The market demand curve cannot be increased.
The nominal interest rate in the U.S. is 5% and the nominal interest rate in Canada is 3%. The spot value of the U.S. dollar is 1 ($/Canadian dollar) and the forward rate is 1.2 ($/Canadian dollar). Which of the following is NOT true?
A) The dollar is likely to appreciate in spot markets. B) The interest parity condition does not hold. C) The dollar is trading at a forward discount. D) Money will flow into the Canada.