You would use a ______ to illustrate the data in this frequency distribution table.
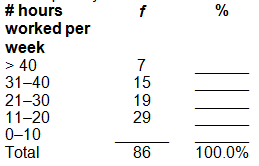
a. pie graph
b. bar chart
c. histogram
d. frequency polygon
c. histogram
You might also like to view...
First and foremost, never lie in an interview
Indicate whether the statement is true or false
Which of the following describes Technological Knowledge (TK) accurately?
a. TK is knowledge that teachers have about educational technologies that support classroom teaching and productivity. b. TK is knowledge that teachers have about ‘high-tech' educational technologies only. c. TK refers to the knowledge teachers must have to teach effectively within a particular content area. d. TK is the understanding teachers develop about the way that technology supports understanding the content area they teach.
Private secondary schools that offered a broad range of subjects and practical training in the 18th century and included courses in mathematics, languages, sciences, astronomy, athletics, and navigation, were
a. Latin grammar schools. b. English grammar schools. c. dame schools. d. academies.
Provide a case example in which a student experiences the special education process. In your example, label each of the following and show in your example that you know how each is relevant to the process: Family Educational Rights and Privacy Act, IEP team, IQ-achievement discrepancy, least restrictive environment, and inclusion.
What will be an ideal response?