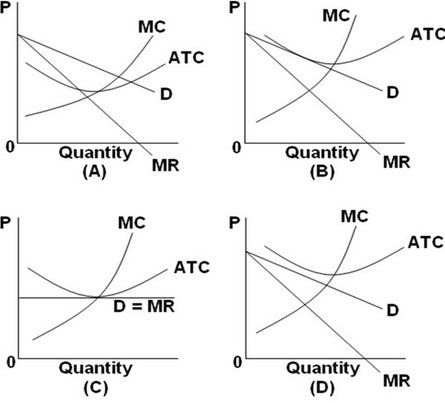
 Refer to the above graphs. The long-run equilibrium for a monopolistically competitive firm is represented by graph:
A. A.
B. B.
C. C.
D. D.
Answer: B
You might also like to view...
The principal-agent view of Fed motivation predicts that the Fed acts
A) to promote the interests of the general public. B) to promote the interests of the Fed's principal—the President of the United States. C) in order to increase its power, influence, and prestige. D) in order to make sure its agents—commercial banks—carry out its wishes.
Any point on the contract curve is Pareto efficient regardless of the initial endowment
Indicate whether the statement is true or false
If there are two goods and two countries, then one country can have
A) an absolute advantage in only one good. B) an absolute advantage in both goods. C) a higher opportunity cost of producing both goods. D) a lower opportunity cost of producing both goods.
According to the graph, if the perfectly competitive outcome and monopoly outcome are compared, we can see that the:
This graph shows the cost and revenue curves faced by a monopoly.
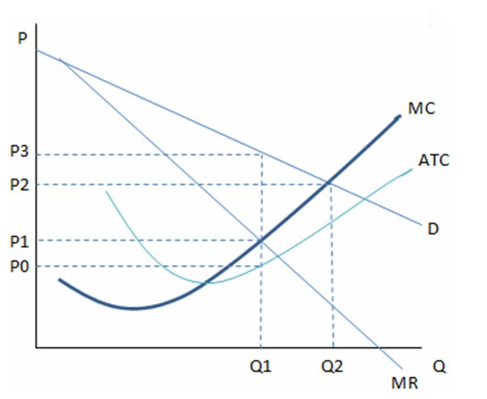
A. monopoly creates deadweight loss.
B. perfectly competitive firm would lose money in this industry.
C. perfectly competitive firm would produce Q1 units.
D. monopolist would charge P3 and the perfectly competitive firm would charge P1.