Based on the graph, find the range of y = f(x).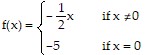
A. (-?, 0) or {0} or (0, ?)
B. (-?, ?)
C. (-10, 10)
D. (-?, 0) or (0, ?)
Answer: D
You might also like to view...
Find the sample standard deviation.56, 79, 29, 29, 44, 47, 24, 82, 53
A. 389.7 B. 18.7 C. 20.9 D. 350.8
Solve.A vendor has learned that, by pricing caramel apples at $1.25, sales will reach 89 caramel apples per day. Raising the price to will cause the sales to fall to 49 caramel apples per day. Let y be the number of caramel apples the vendor sells at x dollars each. Write a linear equation that relates the number of caramel apples sold per day to the price x.
A. y = -40x - 139
B. y = -  x +
x + 
C. y = -40x + 139
D. y = 40x + 39
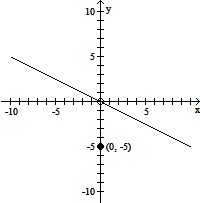
Match the equation with the graph that would most closely resemble its graph.y = -x + 6
A. 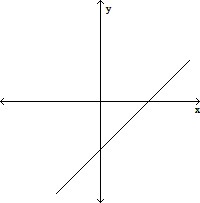
B. 
C. 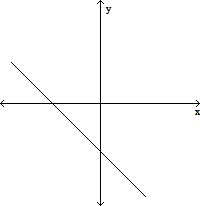
D. 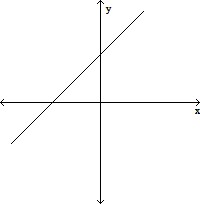
Simplify.(y2)7 ? (y4)8
A. y92 B. y64 C. y108 D. y46