Graph the function by starting with the graph of the basic function and then using the techniques of shifting, compressing, stretching, and/or reflecting.f(x) = x3 + 3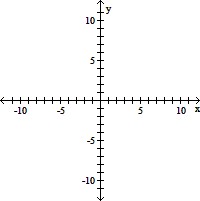
A. 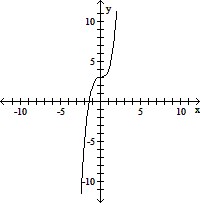
B. 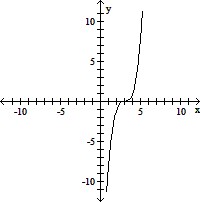
C. 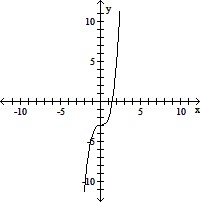
D. 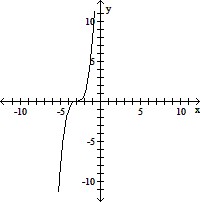
Answer: A
You might also like to view...
Use the principle of square roots to solve the equation.3z2 + 4 = 79
A. 5 B. ±6 C. 39.5 D. ±5
Form a polynomial f(x) with real coefficients having the given degree and zeros.Degree: 4; zeros: -1, 2, and 1 - 2i.
A. f(x) = x4 - x3 + 3x2 - 5x - 10 B. f(x) = x4 - 3x3 - 3x2 + 7x + 6 C. f(x) = x4 - x3 + x2 + 9x - 10 D. f(x) = x4 - 3x3 + 5x2 - x - 10
Solve the problem.The rates of death (in number of deaths per 100,000 population) for 20-24 year olds in a certain country between 2004-2012 are given below. 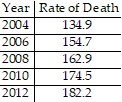 A logarithmic equation that models this data is y = 76.93 + 42.26 ln x where x represents the number of years since 2000 and y represents the rate of death in that year. Use this equation to predict the year in which the rate of death for 20-24 year olds first exceeds 200.
A. 2018 B. 2020 C. 2014 D. 2015
Find the perimeter of (the distance around) the figure.


A. 84 m B. 1,595 m C. 168 m D. 139 m