The following double-bar graph illustrates the revenue for a company for the four quarters of the year for two different years. Use the graph to answer the question. 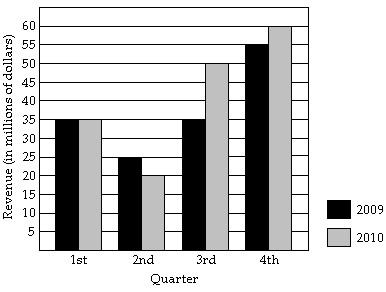 Which quarter for 2010 had the greatest increase in revenue compared to the same quarter for 2009?
A. third quarter
B. first quarter
C. fourth quarter
D. second quarter
Answer: A
You might also like to view...
Find the vector projv u.v = 2i - 2j - 4k, u = 5i - 12k
A.  i -
i -  j -
j -  k
k
B.  i -
i -  j -
j -  k
k
C.  i -
i -  k
k
D.  i -
i -  k
k
Use the ratio test to determine if the series converges or diverges.
A. Converges B. Diverges
A child is 22 inches long at birth and grows to an adult height of 70 inches.
?
?
A: Make a logistic model of the height H, in inches, at age t years. Note: Thus far you are not given sufficient information to determine the value of r in the expression  . Just leave that term as a variable.
?
B: In the model from part A we think of restricting the age to 15. That corresponds to putting
. Just leave that term as a variable.
?
B: In the model from part A we think of restricting the age to 15. That corresponds to putting  in the formula, so H is a function of r. Make a graph of H versus r with . You may assume that r is no larger than 1.
?
C: Use your graph in part B to determine for what value of r the person will reach 90% of adult height at age 15.
?
D: Use the information you found in part C to make a logistic model of height versus age.
?
Round your answers to two decimal places, if necessary.
What will be an ideal response?
in the formula, so H is a function of r. Make a graph of H versus r with . You may assume that r is no larger than 1.
?
C: Use your graph in part B to determine for what value of r the person will reach 90% of adult height at age 15.
?
D: Use the information you found in part C to make a logistic model of height versus age.
?
Round your answers to two decimal places, if necessary.
What will be an ideal response?
Simplify. Be sure to rationalize the denominator. Assume that all variables represent positive real numbers.
A. 
B. 
C. 
D. 