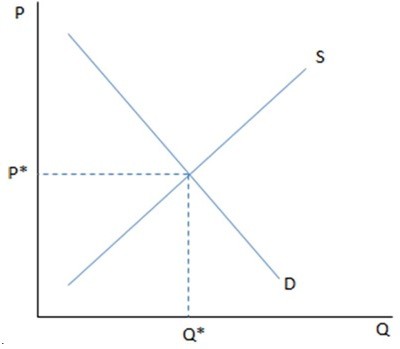
 If the graph shown is displaying a competitive labor market:
A. Q* would represent the equilibrium wage.
B. S would represent the firm's supply of jobs at each wage.
C. P* would represent the equilibrium wage.
D. S would represent an individual worker's supply of labor at each wage.
Answer: C
You might also like to view...
________ will lead to a decrease in the gross domestic product of a country, all other variables remaining unchanged
A) An increase in the expenditure on investment B) A decrease in the expenditure on investment C) An increase in exports D) A decrease in imports
Efficient voting outcomes would assign weights to each vote that are:
A) equal. B) egalitarian. C) higher for the median voter and lower for other voters. D) proportional to the voter's strength of preference.
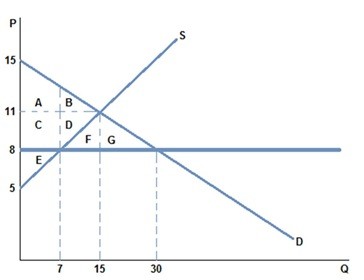 After a price ceiling of $8 is placed on the market in the graph shown, which area represents total surplus?
A. A + B + C + D + E B. A + B + C + D + E + F + G C. A + C + E D. A + B + C + D + E + F
Typical estimates of the sacrifice ratio suggest that about 10 percent of annual output has to be given up in order to reduce the inflation rate from
a. 8 percent to 4 percent. b. 8 percent to 5 percent. c. 7 percent to 5 percent. d. 7 percent to 6 percent.