Use the following figure to answer the next question.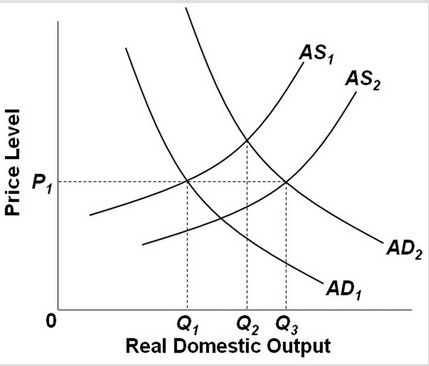 In the figure, AD2 and AS2 represent the original aggregate supply and demand curves. If Q3 is full-employment output, then AD2 and AS1 best represent a period of ________.
A. hyperinflation
B. expansion
C. low unemployment
D. stagflation
Answer: D
You might also like to view...
Which of the following is TRUE about producers' willingness to offer warranties on products?
A) Producers are equally likely to offer warranties on high-quality and low-quality goods. B) Producers are more likely to offer warranties on low-quality goods, because without the signal that the warranty provides, the low-quality good wouldn't sell. C) Producers are more likely to offer warranties on high-quality goods, because the expected cost of repairs is lower for those goods. D) Producers have an incentive to deal with third-party companies to provide the warranties, so that an "impartial" view of the product is given to the consumer. E) Producers will not offer warranties in any market that suffers from asymmetric information.
A good that is most likely to be in the producer price index is:
A. industrial machinery. B. SUV. C. spaghetti. D. All of these are in the PPI.
For this question, assume that the aggregate production function is represented by Y = A. Which of the following represents the marginal cost of producing an additional unit of output?
A) W B) W/A C) A/W D) (1 + A)W E) 1/W
The real GDP in a nation has just increased from $2 billion to $2.1 billion.
A. We do not know if this country experienced economic growth since the increase in the population was not given. B. We do not know if this country experienced economic growth since information on nominal GDP was not given. C. This country has experienced economic growth because there is a $.1 billion increase in real GDP. D. This country did not experience economic growth since $.1 billion is not a large number.