Solve the problem.The following data represents the average monthly minimum temperature for a certain city in California.  Draw a scatter diagram of the data for one period. Find a sinusoidal function of the form
  that fits the data. Draw the sinusoidal function on the scatter diagram. Use a graphing utility to find the sinusoidal function of best fit. Draw the sinusoidal function of best fit on the scatter diagram.
What will be an ideal response?
y = 8.33 sin (0.50x - 2.06) + 57.97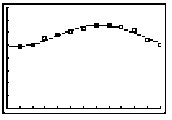
You might also like to view...
Chapter one introduces two different models that can help companies select and implement the most effective strategy. Which of these models suggests that managers should select the most attractive industry and then use the strategy called for by environmental conditions in that industry?
A. The resource-based view of the firm (RBV) model B. The competitive dynamics (CD) model C. The model of strengths, weaknesses, opportunities and threats (SWOT) D. The industrial organization (I/O) model
Find the slope of the line.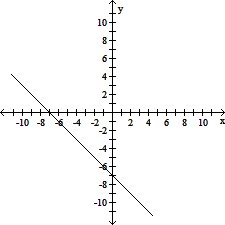
A. -7 B. 1 C. 7 D. -1
Identify the following as an equation or an expression.18 + 6(x - 3) = 18 - x
A. Expression B. Equation
Suppose that in the loan described, the borrower made a larger payment, as indicated. Calculate (a) the time needed to pay off the loan, (b) the total amount of the payments, and (c) the amount of interest saved, compared with the original loan and payments.$5500; 10% compounded monthly; 24 monthly payments; with larger payment of $700.
A. (a) 8 months (b) $5333.58 (c) $291.81 B. (a) 8 months (b) $5600 (c) $393.81 C. (a) 9 months (b) $6300 (c) $444.81 D. (a) 9 months (b) $5712.39 (c) $378.81