According to the graph shown, if this were depicting an autarky, the equilibrium price would be:
This graph demonstrates the domestic demand and supply for a good, as well as the world price for that good.
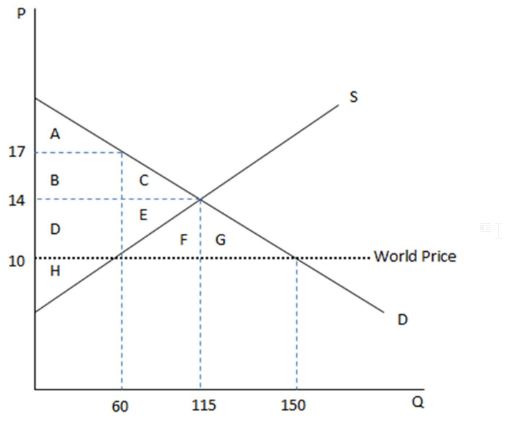
A. $10.
B. $14.
C. $17.
D. $4.
B. $14.
You might also like to view...
Which of the following is an appropriate policy for the Fed to pursue if it wants to increase the money supply?
A) lower taxes B) raise the reserve requirement C) buy U.S. Treasury bills D) raise the discount rate
When a good ends up over consumed and depleted, we can assume it is a:
A. common resource. B. private good. C. public good. D. scarce good.
Import quotas contribute to higher prices of products imported into the U.S., but tariffs do not
a. True b. False Indicate whether the statement is true or false
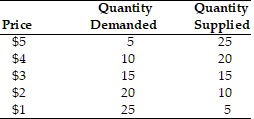 Using the above table, at a price of $5 there will be a
A. surplus of 20 units. B. shortage of 20 units. C. shortage of 10 units. D. surplus of 10 units.