Consumer surplus:
A. does not exist in equilibrium.
B. is illustrated by the area under the demand curve and above the market price.
C. is illustrated by the area under the demand curve and below the market price.
D. is illustrated by the area above the supply curve and under the demand curve.
Answer: B
You might also like to view...
Comparing the AS-AD model and the Phillips curve, we see that
A) they both are graphed as a relationship between the rate of inflation and the unemployment rate. B) the AS-AD model uses the price level and the Phillips curve uses the rate of inflation. C) the AS-AD model is graphed as a relationship between the inflation rate and the rate of real GDP. D) the AS-AD model uses the price level and the Phillips curve uses real GDP. E) the Phillips curve is graphed as a relationship between the price level and the unemployment rate.
Refer to Table 19-3. Consider the data above (in billions of dollars) for an economy: Gross domestic product (in billions of dollars) for this economy equals
A) $2,200. B) $1,600. C) $1,400. D) $1,200.
In moving from a shortage toward the market equilibrium, which of the following is true?
a. Quantity supplied decreases. b. Quantity demanded increases. c. Price falls. d. Price rises.
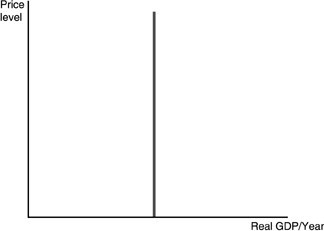 The curve in the above figure will shift to the right when
A. the proportion of the population that is elderly increases. B. population falls. C. labor productivity increases. D. the price level falls.