Solve the problem.The one-day temperatures for 12 world cities along with their latitudes are shown in the table below. Make a scatter diagram for the data. Then find the line of best fit and graph it on the scatter diagram.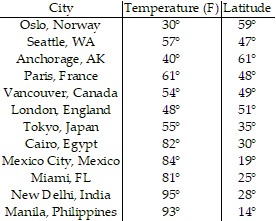 Latitude (degrees)
 Temperature (F)°
What will be an ideal response?
Latitude (degrees)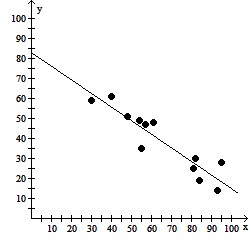
Temperature (F)°
Line of best fit = -0.68x + 82.91
Mathematics
You might also like to view...
Express the integrand as a sum of partial fractions and evaluate the integral.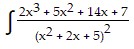 dx
dx
A. -  tan-1
tan-1  -
-  + C
+ C
B. ln  -
-  tan-1
tan-1  + C
+ C
C. ln  -
-  tan-1
tan-1  -
-  + C
+ C
D. ln  -
-  + C
+ C
Mathematics
Find the derivative of the function.y = 
A. y ' = 
B. y ' = 
C. y ' = 
D. y ' = 
Mathematics
Solve the problem.Find the center of mass of the rectangular solid of density  defined by
  ,
,  ,
,  .
.
A.  = 1,
= 1,  =
=  ,
,  =
= 
B.  =
=  ,
,  = 1,
= 1,  =
= 
C.  =
=  ,
,  =
=  ,
,  =
= 
D.  = 2,
= 2,  =
=  ,
,  =
= 
Mathematics
Use the limit comparison test to determine if the series converges or diverges.
A. Diverges B. Converges
Mathematics