A graph showing the inverse relationship between the economy's rate of unemployment and rate of inflation is called the:
a. Laffer curve.
b. aggregate expenditure model.
c. Keynesian cross.
d. Phillips curve.
e. consumption curve.
d
You might also like to view...
The existence of unemployment can be illustrated on a production possibilities curve by a(n)
A. point below or inside the surface of the curve. B. inward shift of the curve. C. movement along the curve. D. outward shift of the curve.
Refer to Figure 14.3. Suppose the economy is initially at long-run equilibrium and the Fed increases the target inflation rate, and to hit this rate, it must reduce the real interest rate. This is best represented by an initial movement from
A) point A to point B. B) point A to point D. C) point A to point C. D) point B to point C.
Refer to the graph shown. A decrease in production costs is likely to cause a movement from: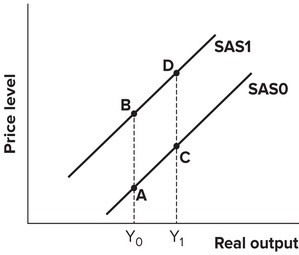
A. B to D. B. B to A. C. C to A. D. C to D.
Aggregate output will decrease if there is a(n)
A. unplanned fall in inventories. B. decrease in consumption. C. unplanned rise in inventories. D. increase in saving.