Use a graphing calculator to plot the data and find the quadratic function of best fit.The number of housing starts in one beachside community remained fairly level until 1992 and then began to increase. The following data shows the number of housing starts since 1992 (x = 1). Use a graphing calculator to plot a scatter diagram. What is the quadratic function of best fit?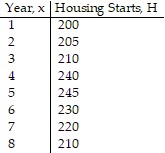
A. H(x) = -2.679x2 - 26.607x + 168.571
B. H(x) = -2.679x2 + 26.607x - 168.571
C. H(x) = 2.679x2 + 26.607x + 168.571
D. H(x) = -2.679x2 + 26.607x + 168.571
Answer: D
You might also like to view...
The graph below shows solution curves of a differential equation. Find an equation for the curve through the given point.
 = sin x + cos x
A. y = sin x - cos x +1 B. y = sin x - cos x -2 C. y = sin x - cos x -1 D. y = sin x - cos x
The height (in feet) of an object dropped off of a bridge can be modeled by the equation s(t) = 16t^2 + 144. How long will it be before the object hits the water below the bridge?
What will be an ideal response?
Solve the problem.The inequality |T - 35| ? 18 describes the range of monthly average temperatures T in degrees Fahrenheit at a City X. (i) Solve the inequality. (ii) If the high and low monthly average temperatures satisfy equality, interpret the inequality.
A. 14 ? T ? 56; The monthly averages are always within 
B. T ? 53; The monthly averages are always less than or equal to 
C. 17 ? T ? 53; The monthly averages are always within 
D. 14 ? T; The monthly averages are always greater than or equal to 
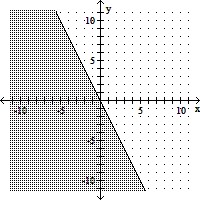
Graph the inequality.x < -2y
A. 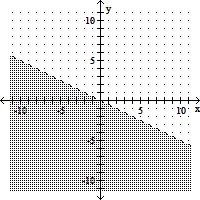
B. 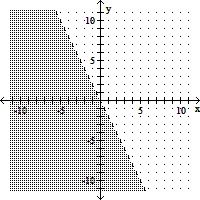
C. 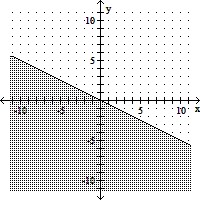
D.