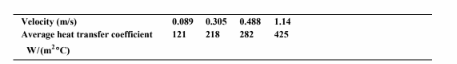
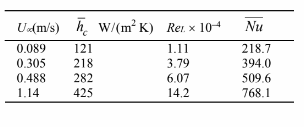
The experimental data shown tabulated were obtained by passing n-butyl alcohol at a bulk temperature of 15°C over a heated flat plate (0.3-m-long, 0.9-m-wide, surface temperature of 60°C). Correlate the experimental data using appropriate dimensionless numbers and compare the line which best fits the data with Equation 5.38.
GIVEN
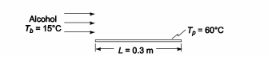
n-butyl alcohol flowing over a heated flat plate
Bulk temperature (Tb) = 15°C
Plate surface temperature (Tp) = 60°C
Plate length (L) = 0.3 m
Plate width (w) = 0.9 m
The experimental data given above
FIND
(a) Correlate the data by appropriate dimensionless numbers
(b) Compare line which best fits the data with Equation 5.38
ASSUMPTIONS
Steady state
Alcohol flows parallel to the length of the plate
Plate temperature is uniform
SKETCH
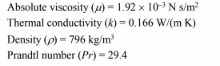
PROPERTIES AND CONSTANTS
From Appendix 2, Table 19: For n-butyl alcohol at the average of the bulk and surface temperatures
(known as the film temperature): 37.5°C.
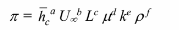
(a) The relevant variables and their primary dimensions are listed below
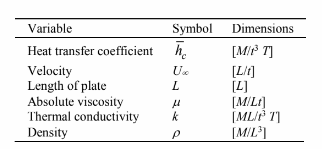
Note: Specific heat should be included in this list, but we suspect that it will show up as a Prandtl
number which is constant for the series of tests performed. Therefore, we can easily extract its
contribution. There are 6 variables are 4 primary dimensions, therefore, they can be correlated with
two dimensionless groups. These dimensionless groups can be determined by the Buckingham ? Theorem
Equating the primary dimensions
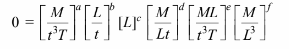
Equating the sums of the exponents of each primary dimension
For T: 0 = – a – e [1]
For M: 0 = a + d + e + f [2]
For t: 0 = – 3a – b – d – 3e [3]
For L: 0 = b + c – d + e – 3f [4]
There are four equations and six unknowns. Therefore, the values of two of the exponents may be
chosen for each dimensionless group.
For ?1, Let f = 1 e = 0
From equation [1]: a = 0
From equation [2]: d = – 1
From equation [3]: b = 1
From equation [4]: c = 1
For ?2, Let a = 1 d =
From equation [1]: e = – 1
From equation [2]: f = 0
From equation [3]: b = 0
From equation [4]: c = 1
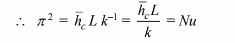
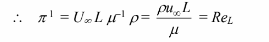
The range of Prandtl number is insufficient to get a functional relationship, therefore the data can be
correlated by the Nusselt number and the Reynolds number:
Calculating ReL and Nu for each data point
On a log-log plot, these points fall roughly on a straight line
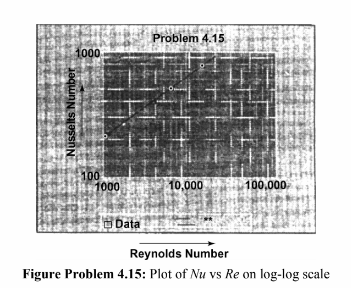
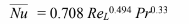
The linear regression gives the following line
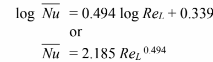
(b) For this problem, Pr = 29.4. Including this in the correlation
Equation 5.38 for laminar flow over a flat plate is
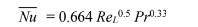
which is about 7% less than our experimental data.
You might also like to view...
A fish weighing 16 N is weighed using two spring scales, each of negligible weight, as shown in the figure. What will be the readings of the scales?
A) The bottom scale will read 16 N, and the top scale will read zero. B) Each scale will read 16 N. C) The top scale will read 16 N, and the bottom scale will read zero. D) The scales will have different readings, but the sum of the two readings will be 16 N. E) Each scale will read 8 N.
One light-minute is the distance light travels in one minute. The speed of light is about 300,000 km/s (3×10⁵ km/s). How far is one light-minute?
A) 300 thousand km (300,000, or 3 × 10⁵ km) B) 9.46 trillion km (9,460,000,000,000, or 9.46 × 10¹² km) C) 1.08 billion km (1,080,000,000, or 1.08 × 10⁹ km) D) 18 million km (18,000,000, or 1.8 × 10⁷ km)
A block is launched up an inclined plane. After going up the plane, it slides back down to its starting position. The coefficient of friction between the block and the plane is 0.3 . The speed of the block when it reaches the starting position on the trip down:
a. is the same as the launching speed. b. is less than the launching speed. c. is more than the launching speed. d. cannot be compared to the launch speed with the information given.
A 5-mol ideal gas system undergoes an adiabatic free expansion (a rapid expansion into a vacuum), going from an initial volume of 10 L to a final volume of 20 L. How much work is done on the system during this adiabatic free expansion?
a. -50 J c. zero b. -10 J d. +50 J