Make a line graph of the data.The following table gives the average cost of producing a music video over the given years. Use time on the horizontal scale for your line graph.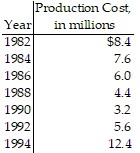
What will be an ideal response?
Answers may vary. A possible answer follows.
Mathematics
You might also like to view...
Solve and graph. Write the solution set in set-builder and interval notation.6z - 12 ? 5z - 6![]()
A. {z| z ? 6}; [6, ?)![]()
B. {z| z < 6}; (-?, 6)![]()
C. {z| z > 6}; (6, ?)![]()
D. {z| z ? 6}; (-?, 6]![]()
Mathematics
Solve the equation. Write the answer in a + bi form.x4 + 16 = 0
A. 8 + 8
+ 8 i, 8
i, 8 - 8
- 8 i, -8
i, -8 + 8
+ 8 i, -8
i, -8 - 8
- 8 i
i
B. 1 + i, 1 - i, -1 + i, -1 - i
C.  +
+  i,
i,  -
-  i, -
i, -  +
+  i, -
i, -  -
-  i
i
D. 2 + i, 2 - i, -2 + i, -2 - i
Mathematics
Determine whether the equation is a function.y2 + x = 6
A. function B. not a function
Mathematics
Write each whole number in expanded form.1639
A. 9000 + 300 + 60 + 1 B. 1000 + 600 + 30 + 9 C. 1,639,000 D. 100 + 30 + 6
Mathematics