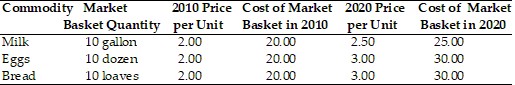
 Considering the data in the table shown above and 2010 as the base year, what is the inflation rate between years 2010 and 2020?
A. 3.4 percent
B. 41.7 percent
C. 17.1 percent
D. 0.0 percent
Answer: B
You might also like to view...
Under the bimetallic system, when did the U.S. experience a depletion in its reserve species?
(a) When imports exceeded exports (b) When exports exceeded imports (c) When the U.S. closed its borders to all international trade (d) When the trading partners of the U.S. refused all U.S. imports
Monetarists and classical economists:
a. assume that stimulative monetary policy will create high levels of GDP without inflation. b. assume that stimulative monetary policy will create high levels of GDP and slightly high prices. c. assume the economy operates at full employment and stimulative monetary policy will only cause the price level to rise. d. assume that the economy operates at full employment and stimulative monetary policy will increase both aggregate supply and aggregate demand. e. assume that the Keynesian description of monetary policy underestimates the true stimulative effect of an increase in the money supply.
Which of the following would cause a movement up (or leftward) along the demand curve for European autos in the United States?
a. an increase in the price of American autos b. a decrease in the price of American autos c. an increase in income in the United States d. an increase in the price of European cars
That part of the deficit that results from a downturn in economic activity is called the __________ deficit
A) net B) gross C) cyclical D) structural