The graph above shows the initial rate of transport for each substance when the cells are placed in solutions of different concentrations of A, B, and C. Based on these data, substance A is transported via
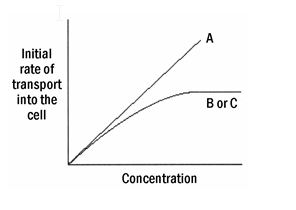
A) active transport.
B) facilitated transport.
C) passive transport.
D) simple diffusion.
E) choices A, B, and C
D) simple diffusion.
Biology & Microbiology
You might also like to view...
An example of a mineral known as a micronutrient that may be toxic to plants is:
A. aluminum B. cadmium C. chromium D. lead E. all of the choices
Biology & Microbiology
The cecum is
a. the first part of the large intestine. b. connects to the rectum. c. between the stomach and the small intestine. d. a producer of enzymes for digestion in the small intestine. e. more than one of these
Biology & Microbiology
Which of the following has the greatest total
energy? a. cAMP b. ADP c. ATP d. glucose e. NADPH
Biology & Microbiology
B and T cells are called lymphocytes
a. true b. false
Biology & Microbiology