Refer to the information provided in Figure 2.4 below to answer the question(s) that follow.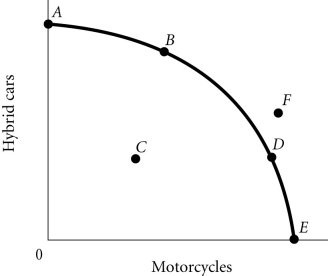 Figure 2.4According to Figure 2.4, an increase in unemployment may be represented by the movement from
A. B to A.
B. A to C.
C. C to D.
D. B to D.
Answer: B
You might also like to view...
Recent research indicates that inflation performance (low inflation) has been found to be best in countries with
A) the most independent central banks. B) political control of monetary policy. C) money financing of budget deficits. D) a policy of always keeping interest rates low.
Assuming no bequests, with a real interest rate of 10 percent, wealth of $60,000, current income of $70,000, current consumption of $30,000 and future income of $100,000, future consumption equals ________
A) $30,000 B) $70,000 C) $100,000 D) $210,000
In the short run, there are large and persistent deviations between actual exchange rates and exchange rates predicted using purchasing power parity because of:
a. Central bank intervention in the foreign exchange market and sticky prices. b. Discretionary monetary policy. c. Discretionary fiscal policy. d. Widely different inflation rates in the two nations. e. All of the above.
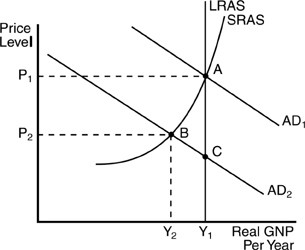 In the above figure, start with the economy in equilibrium at point A. Then an unanticipated reduction in aggregate demand triggers a shift from AD1 to AD2. In the short run, this would cause
A. the price level to fall by some amount less than P1 but greater than P2, and the rate of unemployment would decrease. B. the price level to fall from P1 to P2, real Gross Domestic Product (GDP) to fall from Y1 to Y2, and the rate of unemployment to increase. C. no change in either the price level or real Gross Domestic Product (GDP), but a decrease in unemployment. D. the price level to move from P1 to P2, but real Gross Domestic Product (GDP) would stay at Y1.