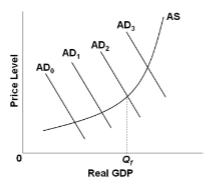
Refer to the diagram, in which Q f is the full-employment output. The shift of the aggregate demand curve from AD 3 to AD 2 is consistent with:
A. an expansionary fiscal policy.
B. a major recession.
C. a contractionary fiscal policy.
D. demand-pull inflation.
C. a contractionary fiscal policy.
You might also like to view...
As welfare rolls declined during the late 1990s and early 2000s,
a. states with aggressive work requirements found that their federal grants also declined b. states with aggressive work requirements were rewarded with larger federal grants c. few welfare recipients were able to find jobs d. there was a significant increase in welfare spending per recipient e. states cut back on their provision of services such as job placement and child care
Bank failures in the United States occurred
A. frequently through the 1960s and declined since then. B. infrequently through the 1960s and have become more common since then. C. frequently through the 1930s, declined after that time, and became more common in 2008. D. infrequently through the 1930s, increased after that time, and became less common in 2008.
Fiscal policy is defined as changes in federal ________ and ________ to achieve macroeconomic objectives such as price stability, high rates of economic growth, and high employment
A) taxes; interest rates B) taxes; the money supply C) interest rates; money supply D) taxes; expenditures
Creating a market that was previously "missing":
A. redistributes surplus from one market to the one that was previously missing. B. redistributes surplus from seller to buyer. C. redistributes surplus from buyer to seller. D. creates more total surplus.