Refer to the information provided in Figure 2.4 below to answer the question(s) that follow.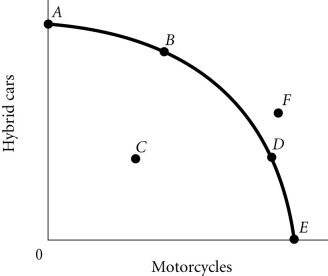 Figure 2.4According to Figure 2.4, a decrease in unemployment may be represented by the movement from
A. B to A.
B. C to D.
C. B to D.
D. A to C.
Answer: B
You might also like to view...
Answer the next question on the basis of the following table in which columns (1) and (2) indicate the transactions demand (Dt) for money and columns (1) and (3) show the asset demand (Da) for money.(1)Interest Rate(2)Dt(3)Da12%$100$010100208100406100604100802100100If the money supply is $160, the equilibrium interest rate will be
A. 8%. B. 4%. C. 10%. D. 6%.
Suppose the market-clearing interest rate on loans is 12%, but law-makers impose an 8% interest rate ceiling. The new law will tend to
A) increase the supply of loans. B) decrease the supply of loans. C) increase the demand for loans. D) decrease the demand for loans. E) do none of the above.
Of the following, which is the best example of good with a perfectly inelastic demand?
A) the demand for gasoline B) the demand for tickets in New York City when the Mets or Yankees are in the World Series C) the demand for a college education by a student who has a full scholarship to an Ivy League school D) a diabetic's demand for insulin
Refer to Figure 21-2. Which of the following is consistent with the graph depicted above?
A) There is a shift from an income tax to a consumption tax. B) The government runs a budget surplus. C) New government regulations decrease the profitability of new investment. D) An expected expansion increases the profitability of new investment. Figure 21-3