The following graph shows average fixed costs, average variable costs, average total costs, and marginal costs of production.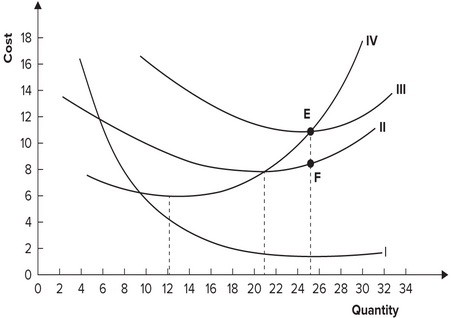 The distance EF represents:
A. marginal cost.
B. average total cost.
C. average fixed cost.
D. average variable cost.
Answer: C
Economics
You might also like to view...
If a European importer can buy $10,000 for 11,100 euros, the exchange rate for the euro is ________.
A. 1 euro = $0.90 B. 1 euro = $1.11 C. 1 euro = $0.80 D. 1 euro = $0.95
Economics
A decrease in demand and an increase in supply are indicated by a. Upward shifts in both curves
b. Downward shifts in both curves. c. Rightward shifts in both curves. d. Leftward shifts in both curves.
Economics
When MC is falling, ATC and AVC
A. must be rising. B. must be falling. C. may be falling or rising. D. will remain constant.
Economics
The only source of economic growth is technological advancement.
Answer the following statement true (T) or false (F)
Economics