A forecaster used the regression equationQt = a + bt + c1D1 + c2D2 + c3D3and quarterly sales data for 1996 I - 2013 IV (t = 1, ..., 64) for an appliance manufacturer to obtain the results shown below. Q is quarterly sales, and D1, D2 and D3 are dummy variables for quarters I, II, and III. 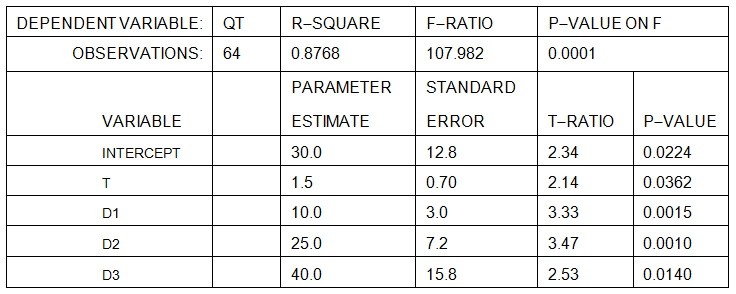 The estimated QUARTERLY increase in sales is ________ units, and the estimated ANNUAL increase in sales is ________ units.
A. 1.5; 40
B. 1.5; 6
C. 1.4; 4
D. 30; 4
E. none of the above
Answer: B
You might also like to view...
Refer to Figure 15-8. Use the figure above to answer the following questions
a. Identify the curves labeled A and B. Identify the curve which contains both point Y and point Z. Identify the curve which contains both point V and point W. b. What is the profit-maximizing quantity and what price will the monopolist charge? c. What area represents total revenue at the profit-maximizing output level? d. What area represents total cost at the profit-maximizing output level? e. What area represents profit? f. What is the profit per unit (average profit) at the profit-maximizing output level? g. If this industry was organized as a perfectly competitive industry, what would be the profit-maximizing price and quantity? h. What area represents the deadweight loss as a result of a monopoly?
Which is a good example of an increase in total factor productivity?
A) a tax cut B) good weather C) a company reducing its workforce D) better credit conditions
Which of the following events would benefit American consumers?
A. The Chinese economy starts to grow more slowly than the U.S. economy. B. South Korea begins to subsidize its auto exports. C. The U.S. dollar experiences depreciation against the euro. D. The U.S. government strengthens trade barriers against foreign imports.
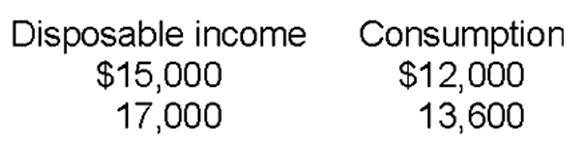
Calculate MPS.