Construct a bar graph to represent the given data.The following table shows the average number of grams of fat in various kinds of entrees served at Karma Kitchen.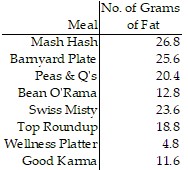
What will be an ideal response?
Answers may vary. The following is a possible answer.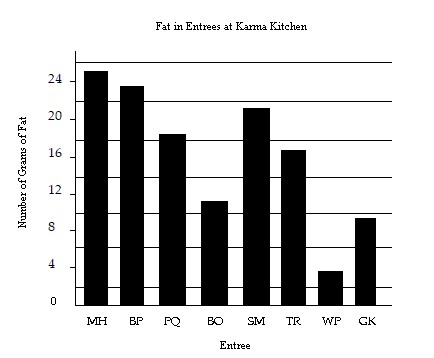
Mathematics
You might also like to view...
How many nth-order partial derivatives does a function of two variables have?
What will be an ideal response?
Mathematics
Find the actual sum.(-1.2) + (2.7)
A. 1.5 B. -3.9 C. 3.9 D. -1.5
Mathematics
Solve and graph the inequality. (x + 6) ?
  (x + 1)
![]()
A. x ? - 24![]()
B. x ? 24![]()
C. x ? - 24![]()
D. x ? 24![]()
Mathematics
Find the asymptotes of the hyperbola. -
-  = 1
= 1
A. y = 1 ±  x
x
B. y = 1 ±  x
x
C. y = ±  x
x
D. y = ±  x
x
Mathematics