Draw a graph that illustrates X-inefficiency. Explain the concept of X-inefficiency using the graph
What will be an ideal response?
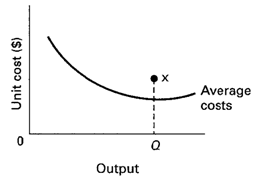
The graph shows the unit costs of production as output increases. There are economies of scale that occur with large-scale production. With X-inefficiency, the monopolist produces a given level of output for a cost that is above the average or unit cost that is possible at that level of output (see point x on graph). The attainable average cost is reflected by the average cost curve, but bad management and “internal” problems for the firm cause costs to be higher than what is technologically attainable.
You might also like to view...
Other things equal, the supply of labor will be lower to a job that
a. offers less strenuous physical activity b. requires a supervisor to closely monitor employee performance c. allows for flexible work schedules d. offers free room and board e. is exciting due to slightly elevated risk
Research and development is most likely to have an impact on the _____
a. quantity of labor available b. quantity of capital goods available c. quality of labor available d. quality of capital goods available e. use of energy
Falling output, in the short run, could be due to:
A. an increase in short-run aggregate supply. B. a reduction in aggregate demand. C. an increase in long-run aggregate supply. D. an increase in aggregate demand.
In the United States during the Great Depression, tariffs were ________ than they were following World War II, and ________ than they are today
A) higher; higher B) higher; lower C) lower; higher D) lower; lower