U.S. Imports and Exports by Area
Go to the table of contents for data found in the Economic Report of the President. Click on the table for U.S. international trade in goods by area.
Questions:
- Report the data in a table with 3 columns: "Area", "Exports", and "Imports" Then for each row of your table you will list an area (such as Euro area or Canada), the most recent levels of U.S. exports to and U.S. imports from that area.
- Which regions provide a trade surplus for the United States?
- What is the value of U.S. net exports to Japan?
Solutions:
- The following table is based on data from the first 3 quarters of 2006 at annual rates (in millions of dollars).

- During the first 3 quarters of 2006, none of these regions provided a trade surplus for the U.S.
- Net exports to Japan were estimated to be equal to -88,887 million in 2006.
You might also like to view...
An increase in the amount of money in circulation would cause a
A) shift of the aggregate demand curve to the right. B) shift of the aggregate demand curve to the left. C) movement up the aggregate demand curve. D) movement down the aggregate demand curve.
How does a weak financial sector intensify the problems created by volatile capital flows?
What will be an ideal response?
Refer to the information provided in Figure 2.5 below to answer the question(s) that follow.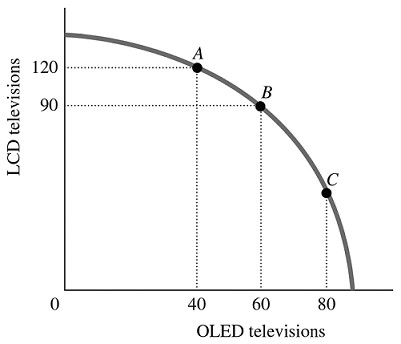 Figure 2.5Refer to Figure 2.5. For this economy to move from Point B to Point C so that an additional 20 OLED televisions could be produced, production of LCD televisions would have to be reduced by
A. more than 30. B. exactly 60. C. fewer than 30. D. exactly 30.
Answer the following statements true (T) or false (F)
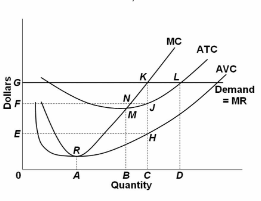
1) Refer to the diagram. This firm will maximize profits by producing output D.
2) Refer to the diagram. At the profit-maximizing output, total revenue will be 0GLD.
3) Refer to the diagram. At any price below R the firm will shut down in the short run.
4)Refer to the diagram. If demand fell to the level of FNJ, there would be no output at which the firm could realize an economic profit.
5) Refer to the diagram. If the firm produced D units of output at price G,