Interpret the table below.
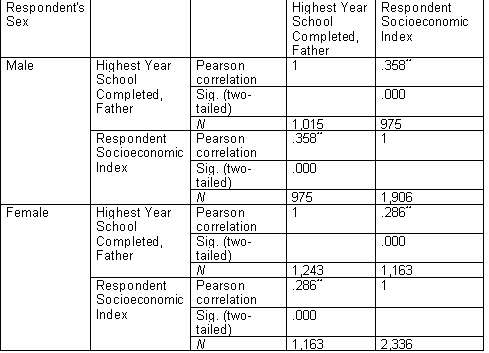
As the scatterplot indicates, the association between father’s education and respondent’s socioeconomic status is positive for both males and females. However, you can see that the lines cross somewhere around 10 years of father’s education. This indicates that while both males and females benefit from their father’s education, males tend to benefit at a greater rate, as indicated by the steeper slope of the fit line. We can also see in the correlation table above that for males the Pearson’s r is equal to .358. On the other hand, for females the Pearson’s r is .286. This indicates that the association of father’s education with respondent’s socioeconomic status is stronger for males than it is for females.
You might also like to view...
Which of the following causes the greatest loss of productivity in the U.S.?
a. mothers' absenteeism due to childcare problems b. alcoholism c. industrial accidents d. poorly trained workforce
Answer the following statement(s) true (T) or false (F)
In all forms of data analysis for the qualitative type of measurement, you will have words to analyze.
The knowledge base for a social work research study should ______.
A. reveal the conclusions of the study B. provide a conceptual framework that portrays the relationships among the variables in the study C. enumerate the tools for measuring the study variables and the statistical tests used to test the hypothesis D. identify the characteristics of the study sample
The Milan team emphasize the use of _____________ questions
a. relative influence. b. circular. c. linear. d. developmental.