If the exchange rate between the yen and the dollar changed from 100 yen = $1 to 110 yen = $1, then
a. the dollar depreciated
b. U.S. goods will become less expensive to the Japanese
c. the dollar appreciated
d. Japanese goods will become more expensive to U.S. citizens
e. the demand for dollars will increase
C
You might also like to view...
Describe the alternative measures of unemployment
What will be an ideal response?
Writing in the New York Times on the technology boom of the late 1990s, Michael Lewis argues, "The sad truth, for investors, seems to be that most of the benefits of new technologies are passed right through to consumers free of charge"
What does Lewis means by the benefits of new technology being "passed right through to consumers free of charge"? A) In the long run, price equals the lowest possible average cost of production. In this sense, consumers receive the new technology "free of charge." B) Firms in perfect competition are price takers. Since they cannot influence price, they cannot dictate who benefits from new technologies, even if the benefits of new technology are being "passed right through to consumers free of charge." C) In perfect competition, price equals marginal cost of production. In this sense, consumers receive the new technology "free of charge." D) In perfect competition, consumers place a value on the good equal to its marginal cost of production and since they are willing to pay the marginal valuation of the good, they are essentially receiving the new technology "free of charge."
With reference to the graph above, if the intended aim of the price ceiling shown was a net increase in the well-being of consumers, then positive analysis would conclude:
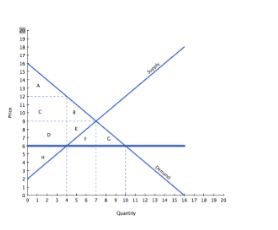
A. the policy was effective, since area A + C is larger than B + D.
B. the policy was effective, since area B is smaller than area D.
C. the policy was ineffective, since D is larger than E.
D. the policy was ineffective, since A + C + D is larger than B + E.
According to the graph shown, if this economy were open to free trade, and decided to impose a tariff, the domestic quantity demanded would:
This graph demonstrates the domestic demand and supply for a good, as well as a tariff and the world price for that good.
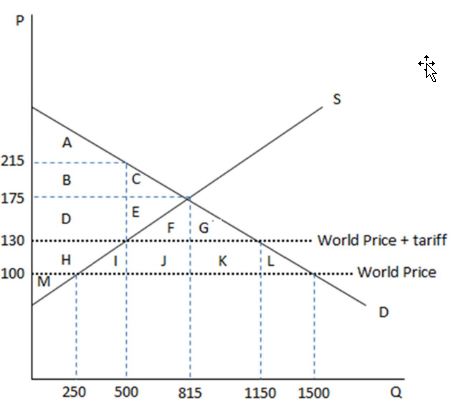
A. decrease from 1500 to 1150.
B. increase from 1150 to 1500.
C. increase from 815 to 1150.
D. decrease from 1150 to 815.