If Matt's disposable income increases from $4,000 to $4,500 and his level of saving increases from $200 to $325, it may be concluded that his marginal propensity to:
A. Consume is .80
B. Consume is .75
C. Consume is .60
D. Save is .30
B. Consume is .75
You might also like to view...
The figure above shows a
A) cross-section graph. B) scatter diagram. C) time-series graph. D) trend diagram. E) slope.
The above figure shows the market for rice in Japan. S2 represents the domestic supply curve, and S1 represents the world supply curve. A $1 per unit tariff has the same effect on producer and consumer surplus as a quota of
A) 10 units. B) 20 units. C) 30 units. D) 40 units.
The demand curve is the graphical counterpart to the
A. supply curve. B. supply schedule. C. market equilibrium. D. demand schedule.
Refer to the data. If a lump-sum tax (the same tax amount at each level of GDP) of $40 is imposed in this economy, the marginal propensity to consume is:
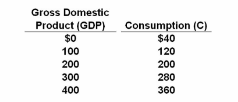
Answer the question on the basis of the following before-tax consumption schedule for a closed economy:
A. .8 before taxes and .6 after taxes.
B. .8 both before and after taxes.
C. .6 before taxes and .8 after taxes.
D. .8 before taxes and .4 after taxes.