The total number of runs scored by the players in the previous problem is 198. The following pie chart shows the percentage of runs scored by each player:
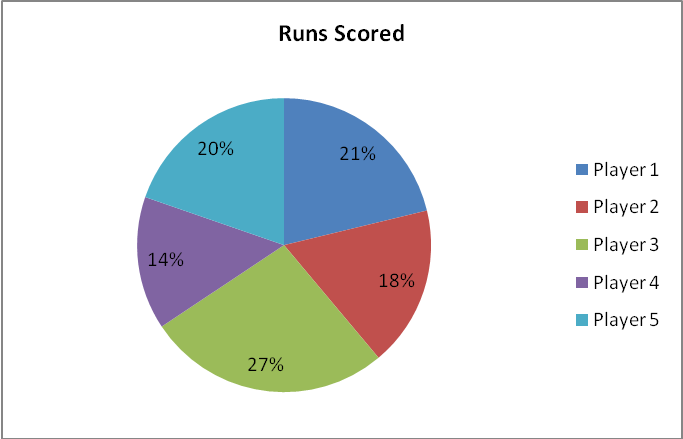
- What are the problems with using a pie chart to display these data?
- What type of chart would be preferred for displaying the data in this pie chart?
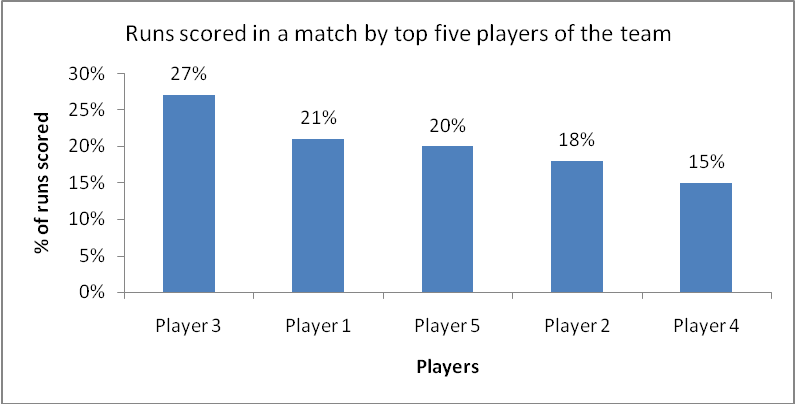
- Use a different type of chart to display the percentage of runs scored by each player that conveys the data better than the pie chart. Format the chart and add data labels to improve the chart’s readability.
- In the pie chart, it is difficult to perceive differences in area. It can also be difficult to distinguish the different colors in the pie chart. Finally, it takes a lot of work for the reader to match the players to the different pieces of the pie chart.
- A sorted column or bar chart would be preferable to display the data in this pie chart.
You might also like to view...
What valuable functions can brands perform for a firm?
What will be an ideal response?
Because low response rates increase the probability of response bias, an attempt should always be made to improve the response rate
Indicate whether the statement is true or false
A foreign currency contract bought or sold forward to protect against foreign currency movement is a ______________ hedge.
Fill in the blank(s) with the appropriate word(s).
Why are models of the creative process valuable to those working in the creative area of advertising?
A. The models are usually developed based on the primacy effect. B. The models create heuristics needed to determine whether or not an ad will accomplish its goals. C. The models enable the client to see what he or she is paying for. D. The models provide an organized approach to an advertising problem. E. The models provide an unstructured approach to an advertising problem.