Solve.Suppose that a polynomial function is used to model the data shown in the graph below. For what intervals is the function increasing?
A. 0 through 40
B. 0 through 10 and 25 through 40
C. 0 through 10 and 20 through 50
D. 10 through 25 and 40 through 50
Answer: B
Mathematics
You might also like to view...
Factor the trinomial containing two variables.x2 + 5xy - 14y2
A. (x + 7y)(x - 2y) B. (x - y)(x + 2y) C. (x - 7y)(x + 2y) D. (x - 7y)(x + y)
Mathematics
Use the graph of the rational function shown to complete the statement.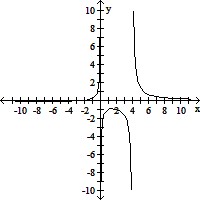 As x?4+, f(x)? ?
A. -? B. 0 C. +? D. 4
Mathematics
Provide an appropriate response.The probability distribution for the random variable X is: 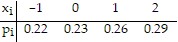 What is the expected value of X?
A. 0.62 B. 0.26 C. 0.22 D. 0.50
Mathematics
Add. + -51
+ -51
A. 
B. 95
C. 
D. 197
Mathematics