Use the following graph to answer the next question.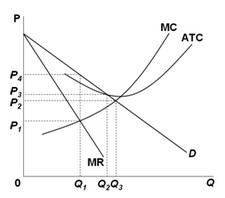 If the government regulated the pure monopoly and made it produce the level of output that would achieve allocative efficiency, what price and quantity of output levels would we observe in the short run?
A. P1 and Q1
B. P2 and Q3
C. P3 and Q2
D. P4 and Q1
Answer: B
You might also like to view...
Of the choices given below, Jimmy, whose utility of wealth schedule is given above, prefers
A) option A: $300 with certainty. B) option B: 50 percent chance of $200 and 50 percent chance of $400. C) option C: 50 percent chance of $200 and 50 percent chance of $700. D) option D: 90 percent chance of $400 and 10 percent chance of $0.
Starting on a Phillips curve with expected inflation equal to 5% and unemployment at its natural rate, show what happens to unemployment if the Fed tries to reduce inflation, but has no credibility
As time passes and people realize that the inflation rate is now lower, what happens to the short-run Phillips curve?
Capital, labor, and other factors of production move more freely from country to country than they do within a country
a. True b. False Indicate whether the statement is true or false
In 2011, the research of Professors Thomas Sargent and Christopher Sims led to ______.
a. the invalidation of rational expectations theory b. the creation of rational expectations theory c. a Nobel prize d. growth in real GDP