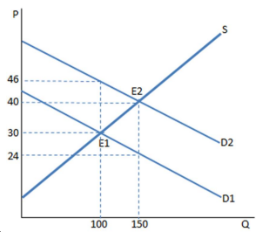
The graph shown best represents which of the following?
A. A tax on sellers
B. A subsidy to sellers
C. A price floor.
D. A subsidy to buyers
D. A subsidy to buyers
You might also like to view...
Mark loves ice cream. At any point in time, he will buy an additional ice cream cone if
A) the marginal benefit from it exceeds the price. B) the marginal benefit from it is zero. C) his willingness to pay is less than the price. D) there is no deadweight loss produced by his purchase of a cone. E) None of the above answers is correct.
A change in a nonprice factor of supply will cause:
A. a movement along the supply curve. B. a shift of the supply curve. C. the supply curve to rotate inward. D. the supply curve to rotate outward.
Which of the following pairs of goods would most likely exhibit a cross price elasticity of -1.8?
a. orange juice and grapefruit juice b. coffee and tea c. a bagel and cream cheese d. a van and a sport utility vehicle
The marginal revenue product of capital is
a. the increase in output that results from employing one more unit of capital b. the increase in profit that results from employing one more unit of capital c. the increase in revenue that results from employing one more unit of labor d. the increase in revenue that results from employing one more unit of capital e. the increase in profits that results from employing one less unit of labor