Graph the linear inequality.x + y < -6
A. 
B. 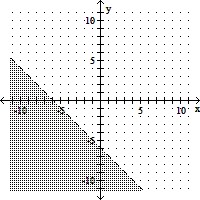
C. 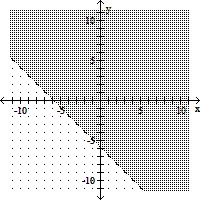
D. 
Answer: B
You might also like to view...
Solve the problem.Suppose that the speed of a car, measured in miles per hour (mph), is monitored for some short period of time after the driver applies the brakes. The following table relates the speed of the car to the amount of time, measured in seconds (sec), elapsed from the moment that the brakes are applied. Make a scatterplot of the data. What is happening to the speed of the car during this time frame?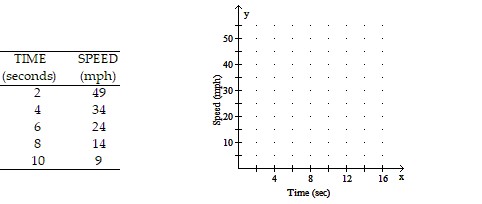
A. The speed of the car
increased as time elapsed.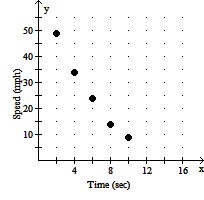
B. The speed of the car
decreased as time elapsed.
C. The speed of the car
decreased as time elapsed.
D. The speed of the car
increased as time elapsed.
Find the term that should be added to the expression to form a perfect square trinomial. Write the resulting perfect square trinomial in factored form.x2 + 18x
A. 324;  2
2
B. 81;  2
2
C. 81;  2
2
D. 0;  2
2
Provide an appropriate response.Explain what is wrong with the statement "The line has no slope."
What will be an ideal response?
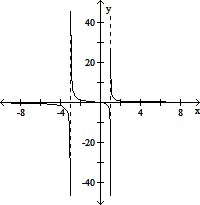
Graph the function.f(x) = 
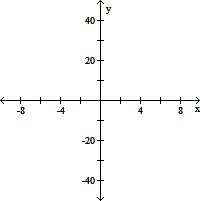
A. 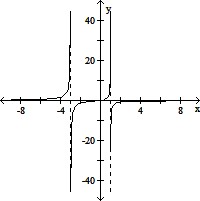
B. 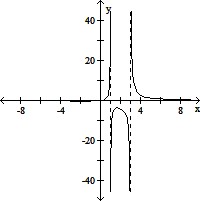
C. 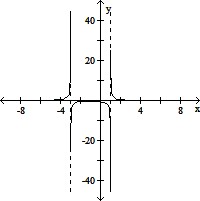
D.