Solve the problem.The one-day temperatures for 12 world cities along with their latitudes are shown in the table below. Make a scatter diagram for the data. Then find the line of best fit and graph it on the scatter diagram.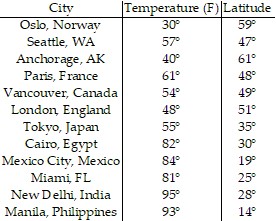 Latitude (degrees)
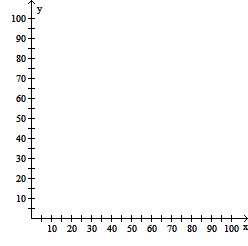 Temperature (F)°
What will be an ideal response?
Latitude (degrees)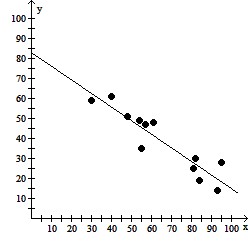
Temperature (F)°
Line of best fit = -0.68x + 82.91
You might also like to view...
If a person drives 208 miles, his average speed S, in miles per hour, for the trip depends on the time t, in hours, spent driving. The relationship is
?
 .
A. Make a graph of average speed versus time spent driving. Include driving times of up to 5 hours.B. Is the graph concave up or concave down?C. For a 208-mile trip, would an increase in speed make more difference in average velocity for a slow driver or for a fast driver?
.
A. Make a graph of average speed versus time spent driving. Include driving times of up to 5 hours.B. Is the graph concave up or concave down?C. For a 208-mile trip, would an increase in speed make more difference in average velocity for a slow driver or for a fast driver?
What will be an ideal response?
Describe the curve represented by the equation. Identify the type of curve and its center (or vertex if it is a parabola). +
+  = 1
= 1
A. Ellipse, (2, 0) B. Parabola, (2, 0) C. Ellipse, (0, 2) D. Hyperbola, (0, 2)
Graph the equation.y = 3

A. 
B. 
C. 
D. 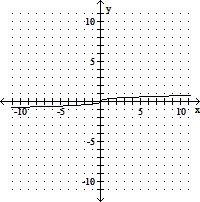
Use a proportion to solve the problem.A building casts a shadow 39 m long. At the same time, the shadow cast by a 41-cm tall pole is 53 cm long. Find the height of the building. Round your answer to the nearest tenth of a meter.
A. 48.9 m B. 50.4 m C. 28.7 m D. 30.2 m