The following double-bar graph illustrates the revenue for a company for the four quarters of the year for two different years. Use the graph to answer the question.  Which quarter for 2010 had the greatest decrease in revenue compared to the same quarter for 2009?
A. fourth quarter
B. second quarter
C. third quarter
D. first quarter
Answer: B
Mathematics
You might also like to view...
Consider the points plotted in the graph below.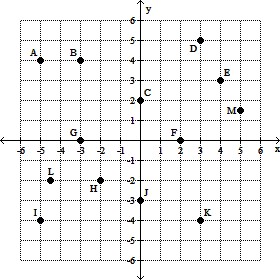 Give the coordinates for point B.
A. (4, -3) B. (-5, 4) C. (3, 4) D. (-3, 4)
Mathematics
Choose the graph that matches the given function.f(x) = 
A. 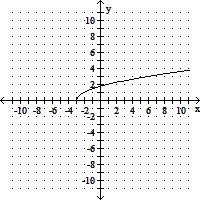
B. 
C. 
D. 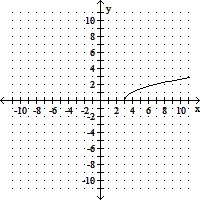
Mathematics
Factor the polynomial.8y2 + 18y + 9
A. (2y + 3)(4y + 3) B. (8y + 3)(y + 3) C. (2y - 3)(4y - 3) D. prime
Mathematics
Find the slope of the line containing the two given points.(5, -17) and (11, -4)
A. - 
B. - 
C. 
D. 
Mathematics