Provide an appropriate response.The bar graph shows the mean area of office space, in square feet, per worker at a certain company for four selected years.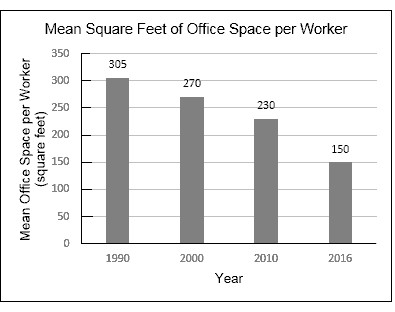 Office area per worker, A, in square feet, can be modeled by A = -5x + 320, where x is the number of years after 1990.a) Use the formula to find the office area per worker in 2010.b) Does the area per worker obtained in part (a) underestimate or overestimate the area displayed by the graph? By how much?
What will be an ideal response?
a) 220 square feet; b) underestimates by 20 square feet
Mathematics
You might also like to view...
Divide. Leave your answer in exponent form. Assume that all variables in any denominator are nonzero.
A. 
B. 
C. 8x4y3
D. 
Mathematics
Tell whether the fractions are equivalent or not equivalent. and
and 
A. Equivalent B. Not equivalent
Mathematics
Four players (A, B, C, and D) agree to divide the 16 items shown below by lining them up in order and using the method of markers. The players' bids are as indicated.
 Item 15
A. goes to A. B. goes to B. C. goes to C. D. goes to D. E. is left over.
Mathematics
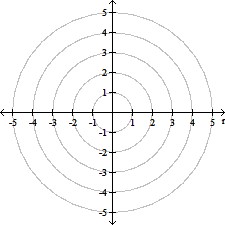
Plot the point given in polar coordinates.
A. 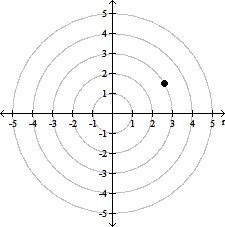
B. 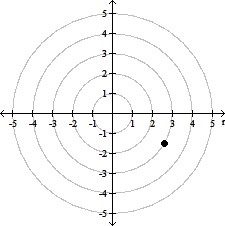
C. 
D. 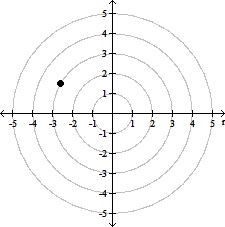
Mathematics