Referring to Figure 1.8, if a point represents unemployment, it is in 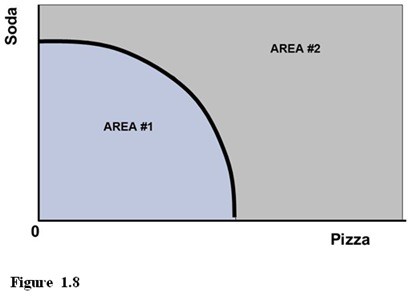
A. AREA #1 but not on the curve.
B. AREA #2 but not on the curve.
C. AREA #1 or is on the curve.
D. AREA #2 or is on the curve.
Answer: A
You might also like to view...
Last year Christine worked as a consultant. She hired an administrative assistant for $15,000 per year and rented office space (utilities included) for $3,000 per month. Her total revenue for the year was $100,000. If Christine hadn't worked as a consultant, she would have worked at a real estate firm earning $40,000 a year. Last year, Christine's accounting profit was ________ and her economic profit was ________.
A. $64,000; $49,000 B. $100,000; $64,000 C. $9,000; 0 D. $49,000; $9,000
"When the Fed is concerned with an inflationary gap it buys government securities." Is the previous statement correct or incorrect? Explain your answer
What will be an ideal response?
As the circular flow model points out, a choice that households make is how
A) many resources a firm will hire. B) many goods and services are produced. C) many goods and services are purchased. D) much labor is hired. E) much the government will collect in taxes and how much the government will spend on transfer payments.
What is the best description of Northern wages from 1860-1864?
a. A relatively large decrease in demand relative to the decrease in supply led to lower wages and fewer people working. b. An increase in the demand for labor and decrease in the supply of labor led to lower wages and fewer people working. c. Increases in both the demand and supply for labor led to more people employed who were working for about the same wages. d. A decrease in the demand for labor coupled with an increase in the supply led to many fewer people working, but those who were employed worked for higher wages.