Solve the problem.The following table shows the proportion of traffic accidents caused by drivers with the given years of driving experience. 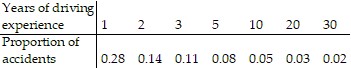 Determine whether a correlation exists between the years of driving experience and the proportion of accidents at
A. No
B. Yes
Answer: A
Mathematics
You might also like to view...
Choose the best answer.The mass of your math text book is about how much?
A. 1.3 metric tonnes B. 1.3 grams C. 1.3 milligrams D. 1.3 kilograms
Mathematics
Graph the function over a one-period interval.y = 4 + 2 sin(x - ?)
A. 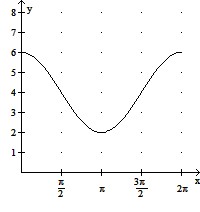
B. 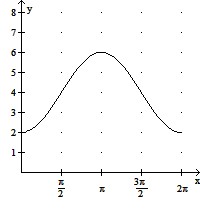
C. 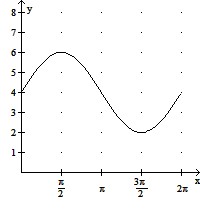
D. 
Mathematics
Sketch the graph of the polar equation.r = 3(1 + 2 sin ?)
A. 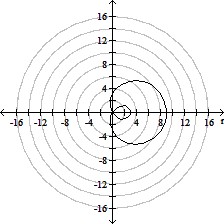
B. 
C. 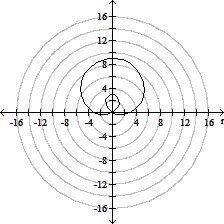
D. 
Mathematics
Find the perimeter of the polygon.Square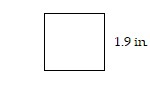
A. 3.8 in. B. 7.22 in. C. 17.6 in. D. 7.6 in.
Mathematics