How can a rubber band be used to explain elasticity and inelasticity of demand?
Please provide the best answer for the statement.
Elasticity of demand is depicted by the sketchiness of the rubber band. If the rubber band stretches substantially when pulled, the rubber band is elastic. This represents elastic demand because a moderate pull (change in price) causes a substantial change in the length of the rubber band (demand). The opposite is true in the case of inelastic demand: When pulled with the same amount of force as before (change in price), a rubber band stretches very little (small change in demand).
You might also like to view...
In the long run, there are no fixed costs
a. true b. false
Exhibit 16-1 Money market demand and supply curves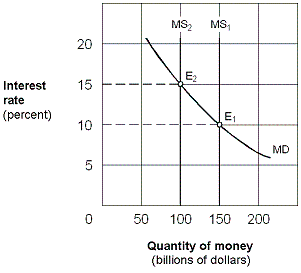 Starting from an equilibrium at E1 in Exhibit 16-1, a leftward shift of the money supply curve from MS1 to MS2 would cause an excess:
A. demand for money, leading people to sell bonds. B. demand for money, leading people to buy bonds. C. supply of money, leading people to sell bonds. D. supply of money, leading people to buy bonds.
For a given level of inflation, if there is a greater willingness by foreigners to purchase domestic goods, then the ________ shifts ________.
A. short-run aggregate supply line; upward B. aggregate demand curve; left C. short-run aggregate supply line; downward D. aggregate demand curve; right
An iron and steel manufacturing plant was facing a power crisis on a daily basis. The unit had to stall production for about two hours on an average per day. In order to minimize the loss, the owner decided to invest in a cogeneration unit that would produce enough power to facilitate production during the peak load hours. This action of the manufacturer exemplifies:
A. a monopoly-pricing strategy. B. a forward or downstream integration. C. a backward or upstream integration. D. a dual-pricing strategy.