The table shows, for some particular year, a listing of several income levels and, for each level, the proportion of the population in the level and the probability that a person in that level bought a new car during the year. Given that one of the people who bought a new car during that year is randomly selected, find the probability that that person was in the indicated income category. Round your answer to the nearest hundredth. 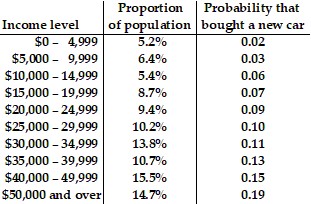 $15,000 - $19,999
A. 0.07
B. 0.08
C. 0.05
D. 0.04
Answer: C
Mathematics
You might also like to view...
Find the distance between the points, and find the midpoint of the line segment joining them.(?, 0) and (?/4, 1)
A.  ;
; 
B.  ;
; 
C.  ;
; 
D.  ;
; 
Mathematics
Find the equation of the line that has the given properties. Write the equation in slope-intercept form, if possible. Contains (5, -2); perpendicular to the line y =  x + 4
x + 4
A. y = - 4x - 18
B. y = - 4x + 18
C. y = -  x -
x - 
D. y = 4x - 18
Mathematics
Provide an appropriate response.Solve by factoring: p2 = 4p + 21
Fill in the blank(s) with the appropriate word(s).
Mathematics
Solve the system by the elimination method. x - 5y = -5-3x - 4y = 15
A. {(-5, 0)} B. {(5, -1)} C. ? D. {(-4, -5)}
Mathematics