Refer to the graph below representing the market demand curve for a monopolist’s output. Which of the following quantities shown on the graph should the monopolist produce if it wishes to maximize its total revenue?
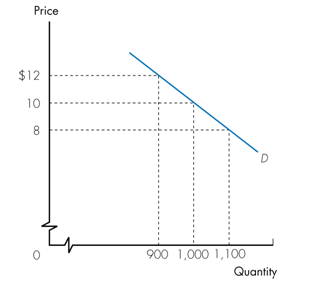
a. 900
b. 1,000
c. 1,100
d. Any of the above because total revenue does not change with a change in production.
a. 900
You might also like to view...
If the economy is at point 1 in Figure 13.1 and there is no policy intervention, what happens next?
A) the economy moves to point 2 B) the economy remains at point 1 C) the economy moves to the left along the AS curve D) the AS curve shifts down, causing both output and inflation to decline E) the AS curve shifts up, causing both output and inflation to rise
Explain how a regulation requiring banks to keep a given percentage of deposits in an account paying below market interest rates at the Fed is really a tax on banks.
What will be an ideal response?
Refer to the information provided in Figure 26.5 below to answer the question(s) that follow.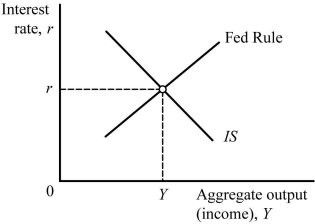 Figure 26.5Refer to Figure 26.5. An increase in government spending shifts the ________ to the ________.
A. IS curve; left B. IS curve; right C. Fed rule; right D. Fed rule; left
The Heyerdahl index is a measure of:
A. Profitability in an industry B. The price level in an industry C. The costs in an industry D. Market power in an industry